In Q2 2021, 5G surpassed 4G worldwide in net additions. As countries around the world deal with different phases of the COVID-19 pandemic, it is clear that technology, and specifically connectivity, increasingly supports many aspects of our everyday lives. Download the full report
For more than 18 months now, the world has faced a crisis on a scale that defies belief. As countries around the world deal with different phases of the COVID-19 pandemic, it is clear that technology, and specifically connectivity, increasingly supports many aspects of our everyday lives.
The resilience and diligence of our industry continues to be evidenced by the striking numbers in this edition of the Ericsson Mobility Report. The speed of 5G uptake is far higher than it was for 4G, let alone 3G, and it is one more sign of an industry that tirelessly continues to drive innovation and bring new technology to the market.
So far, more than 160 communications service providers have launched 5G services and over 300 5G smartphone models have been announced or launched commercially. Before the end of this year, we will have surpassed half a billion 5G users in the world.
However, the picture becomes a bit different when looking at the development on a regional level, where it is clear that it will take longer in some regions for 5G to be deployed and ready for mass-adoption. Nevertheless, whether it’s 4G or 5G, the need for good, high-speed connectivity is virtually limitless. The fact that more than 70 percent of all service providers are now offering fixed wireless access (FWA) services speaks to this need.
As societies plan a return to a more normal situation after the pandemic, the need to secure and invest in high-quality digital infrastructure should be on everyone’s agenda as a key component of economic recovery. It’s a good thing, then, that the industry able to deliver on that need is already on its way to doing so.
- In Q2 2021, the total number of mobile subscriptions was around 8.1 billion, with the net addition of 50 million subscriptions during the quarter.
- China had the most net additions during the quarter (+13 million), followed by Indonesia (+5 million) and the US (+3 million).
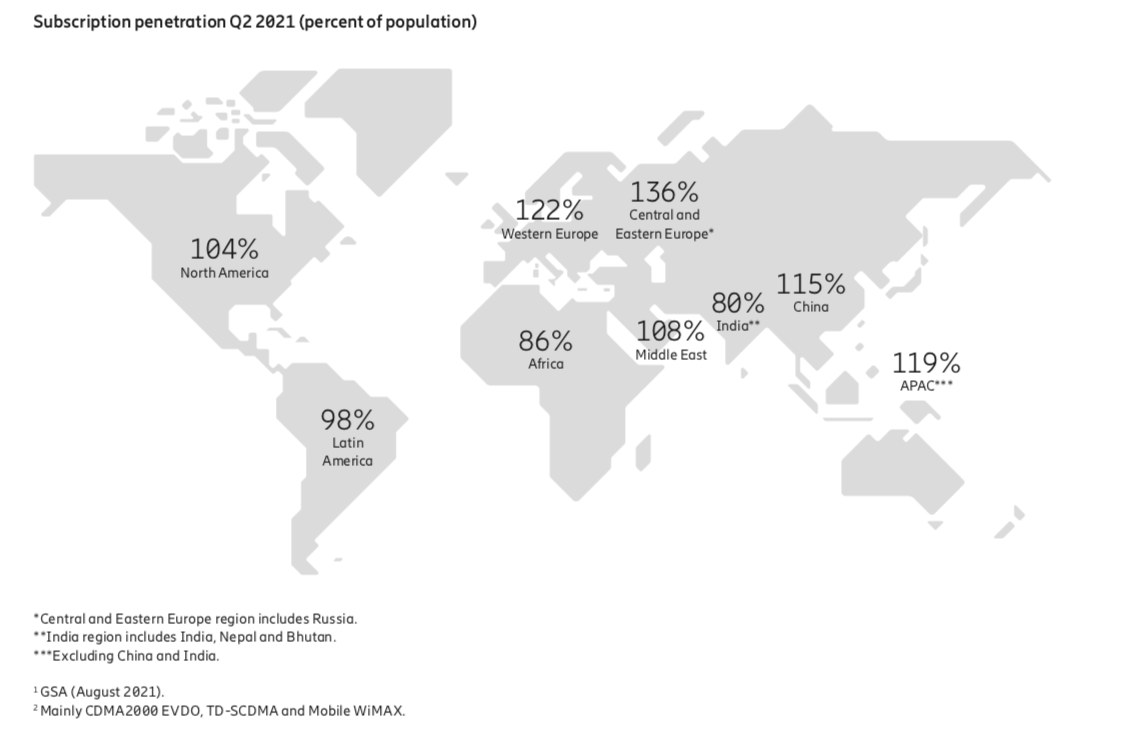
- Global mobile subscription penetration was 103 percent.
- The number of mobile broadband subscriptions grew by about 100 million in the quarter to reach 6.8 billion,
a year-on-year increase of 7 percent.
- 5G subscriptions with a 5G-capable • device grew by 84 million during the
quarter, lifting the total to 380 million. Commercial 5G services have been launched by 176 communications service providers. - 4G subscriptions increased by 71 million to 4.8 billion, representing 59 percent of all mobile subscriptions, while WCDMA/HSPA subscriptions declined by 46 million. GSM/EDGE-only subscriptions dropped by 52 million during the quarter, and other technologies decreased by 7 Million
- The number of unique mobile subscribers is about 6 billion. The difference between the number of subscriptions and the number of subscribers is due to inactive subscriptions, multiple device ownership and/or optimization of subscriptions for different types of calls.

Mobile network traffic Q2 2021
Mobile network data traffic grew 44 percent between Q2 2020 and Q2 2021, and reached 72EB/month.
As in 2020 and Q1 2021, the year-on-year traffic growth rate remained at a normal level – 44 percent – compared to the extraordinary peak in 2018 and the first part of 2019. Total monthly mobile network data traffic reached 72EB. The quarter-on-quarter growth rate was around 9 percent.
Over the long term, traffic5 growth is driven by both the rising number of smartphone subscriptions and an increasing average data volume per subscription, fueled primarily by increased viewing of video content. There are large differences in traffic levels between markets, regions and service providers. The graph below shows total global monthly network data and voice traffic from Q2 2014 to Q2 2021, along with the year-on-year percentage change for mobile network data.

